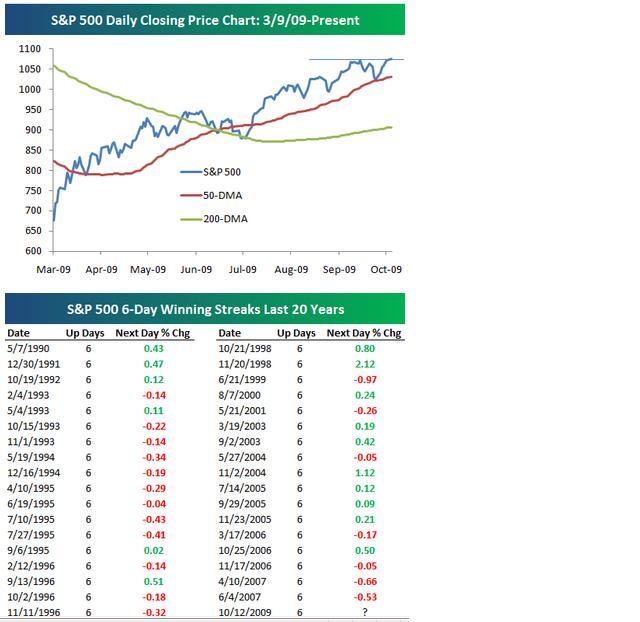
・新しい強気相場の始まり?(画像1)
⇒重要な抵抗をブレイクしたからこの上昇相場はまだまだ続く、、、らしい^^;
New Bull Market Closing High
The S&P 500 was able to make a new bull market closing high today by taking out its prior high of 1071.66. At a price of 1076.19, the index is now about 5 points below its intraday high of 1080.15. From a technical perspective, this new closing high means we should see a continuation of the S&P 500's uptrend.
Today marked the sixth straight day of gains for the S&P 500. This is the first six-day gain for the index since June 2007. Going all the way back to 1927 for the S&P 500, the index has had 215 prior six-day winning streaks, and the average change on day seven has been 0.09%. This is six basis points higher than the average change of 0.03% for all trading days since 1927. In the second chart below, we highlight all six-day winning streaks for the S&P 500 over the last 20 years. Since October 1989, the average change on day seven has been 0.08%.
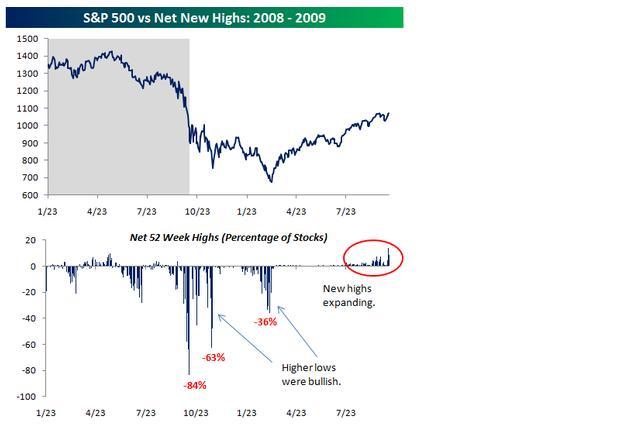
・52週高値更新銘柄が急速に増えてるらしい(画像2)
With the overall stock market approaching new bull market highs, the number of new 52-week highs in the S&P 500 is expanding rapidly. As shown below, the net new highs indicator has come to life on the positive side after remaining stagnant for a few months. Because the year-over-year change in the market remained very negative up until just recently, stocks were not hitting new 52-week highs even though the market had been rallying strongly. Now that we're above levels that we were at one year ago, we're getting numerous 52-week highs on a daily basis. This is to be expected and will remain a bullish sign as long as the number continues to expand. If we see the number of new highs stop expanding or even start contracting, this will be a troubling sign that the bull market could be running out of steam.
2件のコメントがあります
1~2件 / 全2件
ひでたろうさんこんばんわ☆
海外サイトをのぞくと、日本国内の弱気論とは違ってずいぶん強気なコメントが目立ちます^^;国民性の違いでしょうね、、、
>年末までは、この上昇を継続して欲しいです
高値更新銘柄が減り始めるとスピードダウンのサインってことみたいですね~
海外サイトをのぞくと、日本国内の弱気論とは違ってずいぶん強気なコメントが目立ちます^^;国民性の違いでしょうね、、、
>年末までは、この上昇を継続して欲しいです
高値更新銘柄が減り始めるとスピードダウンのサインってことみたいですね~
わりと読みやすい英語だけど、読書スピードが半分に落ちて
晩酌後は、苦痛の世界です
結論は、強気で
大歓迎です
>this will be a troubling sign that the bull market could be running out of steam
年末までは、この上昇を継続して欲しいです
晩酌後は、苦痛の世界です
結論は、強気で
大歓迎です
>this will be a troubling sign that the bull market could be running out of steam
年末までは、この上昇を継続して欲しいです


